Grosses Moos (IntEx)
The intensive agricultural use of the Grosses Moos caused a strong loss of humus and a slumping of the soil of up to two metres. In order to make this loss visible and thus create awareness, the high spatial variability of the humus depth over even short distances is to be illustrated to the students with the help of a field experiment.
Task
With the consent of the landowner, the students were to determine the humus depth along predefined transects in a meadow in the Grosses Moos. The following guiding questions were in the foreground:
- How deep is the humus layer still in this field?
- How variable is the depth of the humus layer?
- Is there a spatial pattern? If so, is the pattern related to the "history" of the floor?
Field experiment
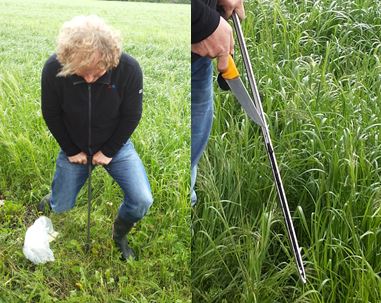
The measurement of humus depth was done with the help of gravers (device for taking soil profiles), as shown in the adjacent figure. A large knife was used to "scrape out" a sample.
Crowd-Sampling Phase
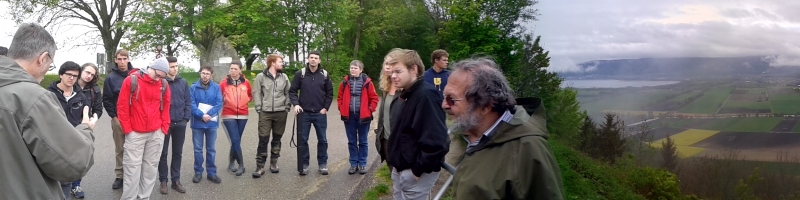
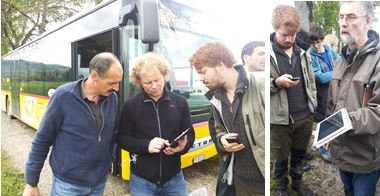
Thirteen people participated in the field experiment, as well as representatives of the Soil Protection Agency of the Canton of Bern. The soil sample was taken in groups of 2 with the help of hand-held drilling sticks.
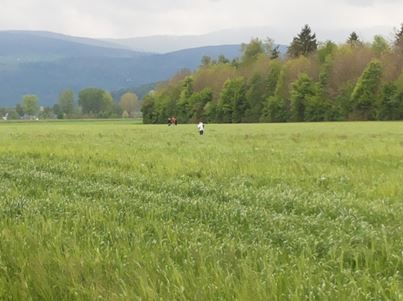
After a 5 - 10 minute introduction to the use of the sampler and the app, the students had about 30 minutes to take the soil samples along their transects, determine the humus depth and enter the results into the app via predefined values. The location of the transects and the respective sampling point were localised using the GPS function of the mobile device. The soil samples were to be taken approximately every 10 m along an assigned transect. The distance was estimated with the help of step lengths.
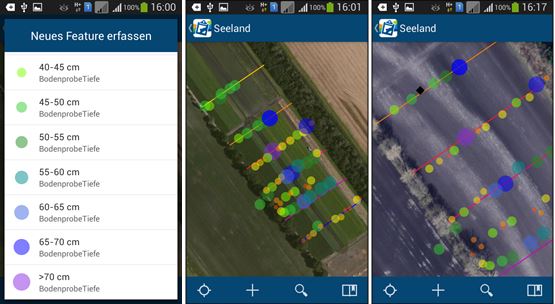
In the time available, a total of 67 (2015: 60) soil samples
could be taken. The humus depth was recorded online and in real time, so that the recorded values were visible to all students. The result is shown below:
Discussion
During the discussion that took place immediately after the experiment and directly on site, the students realised what had previously been taught theoretically: namely, that hardly anything is left of the former peat layers and that the remaining remnants of degraded peat also vary greatly in thickness over short distances. They also spontaneously reported additional differences observed in the soil samples in terms of density, colouration, sand and clay content and moisture.
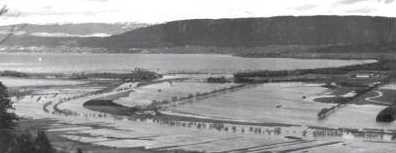
By overlaying the humus depth with an older aerial photograph (see illustrations under Crowd-Sampling Phase), the former course of the river, which still emerges today during large floods, became very apparent. This spontaneously triggered an intensive discussion about what can be done in an original wetland with regulated water levels to prevent further peat loss. Thus, the experiment led directly back to one of the central excursion topics.
Feedback
The feedback from the students on this excursion was predominantly positive. For example, over 90 % of the participants answered that they enjoyed the field experiment.
"The excursion was very exciting and I learned a lot through the active field work as well as the cooperation with the professionals on site."
The feedback from the excursion leader was also positive: "In my eyes, GISsmox more than fulfilled its purpose on our excursion. I was rather speculative at the beginning. But the result, especially in the last year, totally convinced me. My expectations were more than fulfilled and the students were also very taken with being able to do something themselves and not just having to listen." (Prof. Rainer Schulin, Institute for Terrestrial Ecosystems, ETH Zurich, 2015).
Lessons Learned
Sampling leads to deeper engagement with the soil. Through data collection, the students were motivated to carry out the inherently "boring" process of taking samples many times and thus come into direct contact with the variation of the soil. In 2015, the students were also informed in advance that the measurements could show traces of a former river course in order to give the experiment a more clearly defined goal.
Orientation in the field via GPS and offline maps. Because data reception was intermittently interrupted at the sampled site (also for the mobile access points), the groups could not always see the recorded measurement points among themselves synchronously. In experiments where many measurement points are collected in a small area, communication among the groups about selected sample locations is important (e.g. through visual contact).
Incomplete instructions affect data quality. During the 2015 implementation, the instructions for sampling were less detailed due to weather conditions. An initial comparison of the humus depths with the 2014 measurements showed consistently lower humus depths for the 2015 measurements. The discussion revealed that the soil samples had often been taken incompletely. However, this resulted in a constructive discussion about data quality.