Neophytes und Neozoa (IntEx)
Neophytes and neozoa are alien, i.e. non-native, plants or animals that have become established in nature and can thus reproduce. These include, for example, the goddess tree, the giant hogweed, the gorse or the Asian external page tiger mosquitoe (Aedes albopictus). The Swiss flora counts with about 3200 species, including 500 to 600 neophytes. 58 species are counted as invasive or potentially invasive neophytes (see external page info flora).
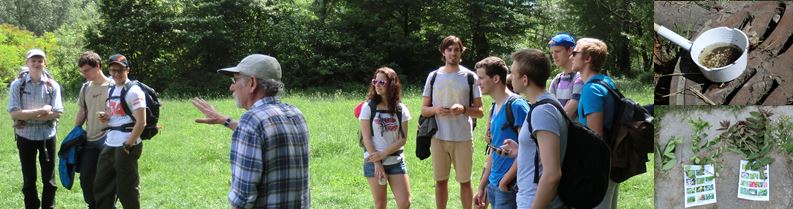
With the help of the two field experiments "Tiger mosquito" and "Akabia quinata", students will be given an understanding of the extent of neophyte and neozoa spread and the topic. The focus is on the significance, dangers and education of neophytes and neozoa as well as on measures for monitoring and combating invasive species.
Task
Within the framework of two mappings, the students are to
- record potential breeding sites of tiger mosquito larvae in the municipalities of Sementina (2014) and Arbedo-Castione and Bellinzona (2015) in Ticino. The following questions are to be addressed: Where are potential breeding areas of tiger mosquito larvae in the municipalities? Which types of breeding sites are predominant? Can a spatial pattern be discerned? How can the tiger mosquito be controlled and what measures are necessary for this? Can the effects of prevention carried out in certain municipalities be identified from the data collected?
- map the natural vegetative spread of Akebia quinatacall_made (chocolate wine), a locally invasive East Asian liana species near Tegna (TI). The goal of the mapping is to visualise the extent of competition with native plant species. This, in turn, will serve as a basis for discussion on the danger and damage caused by neophytes to the environment and to humans. Sampling over several years should allow assumptions to be made about the temporal component of vegetative spread.
Two field experiments were prepared for the implementation.
Field experiment "tiger mosquito"
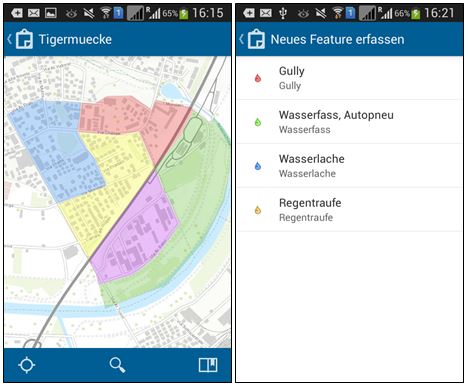
The survey of potential tiger mosquito breeding sites was carried out by walking through the community. The following four types of breeding sites were mapped - using the Collector for ArcGIS App: (1) gully, (2) water barrel, car tyre, (3) water puddle and (4) rain gutter.
No other materials were necessary for this experiment.
In 2015, sampling was carried out using the same methodology in areas with prevention (North Bellinzona) and without prevention (Arbedo Centre). The students were assigned to routes in advance which were made visible in the app.
Field experiemnt "Akebia quinata"
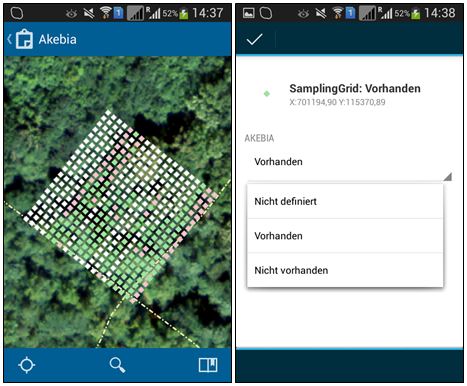
For the mapping of "Akebia quinata", 20 x 20 sample points were calculated at a distance of 2 m each and displayed in the Collector for ArcGIS App. All sample soil points were assigned the property "Not defined" by default. The mapping was also done with the Collector for ArcGIS App. In contrast to the "tiger mosquito" field experiment, however, no new feature was recorded, but only the property of the sample point was adjusted. The following options were available: "present" and "not present".
Crowd-Sampling Phase
31 students divided into groups of two (one group of three) participated in the 2014 field trip. Both mappings took place in real time, so that the students could immediately see the recorded breeding sites or the processed sample points of the other groups.
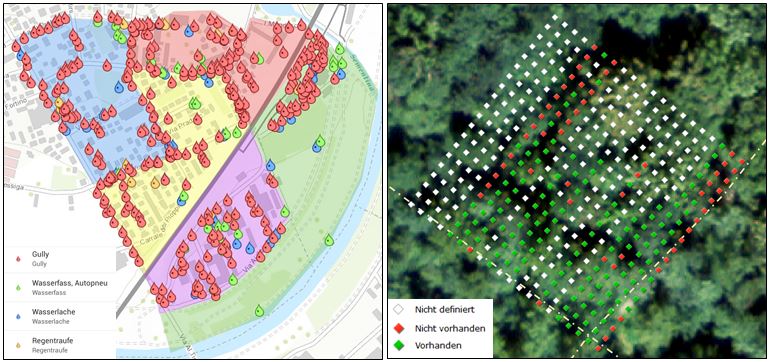
For the mapping of the tiger mosquito in 2014, the area around the motorway service area "Bellinzona-Sud" was divided into five zones and 3 or 4 groups were assigned to each zone. If a potential breeding site was found, the type could be selected via "Record new feature". The localisation was done automatically via integrated GPS, an adjustment could be done manually with the help of the background map. In the available time of about 30 minutes, about 400 objects were mapped, the share of "gullies" being dominant with a number of 305 objects.
During the 2015 excursion, sampling took place in groups of 2 along previously determined routes and starting from two starting points. Within 30 minutes, 570 objects were recorded. Of these, 92 were open vessels, which prevention mainly aims to avoid.
To record the occurrence of Akebia quinata (2014 only), each group had to work on a series of 20 sample points. Within 10 minutes, 190 quadrants could be examined, in 133 of which an offshoot of the plant was found.
Discussion
The survey of the various potential breeding sites for the tiger mosquitoes on both field trips illustrated two aspects in particular: 1) Rainwater gullies are very numerous, but prevention can be organised by the municipality. 2) The prevention of open gullies is in the hands of the population and is carried out to varying degrees. With the chosen approach, the vessels located on private property are far from being completely recorded. When collecting data with students, the assumption is therefore that the frequency of potential breeding sites corresponds to the frequency of those that can be recorded in an area.
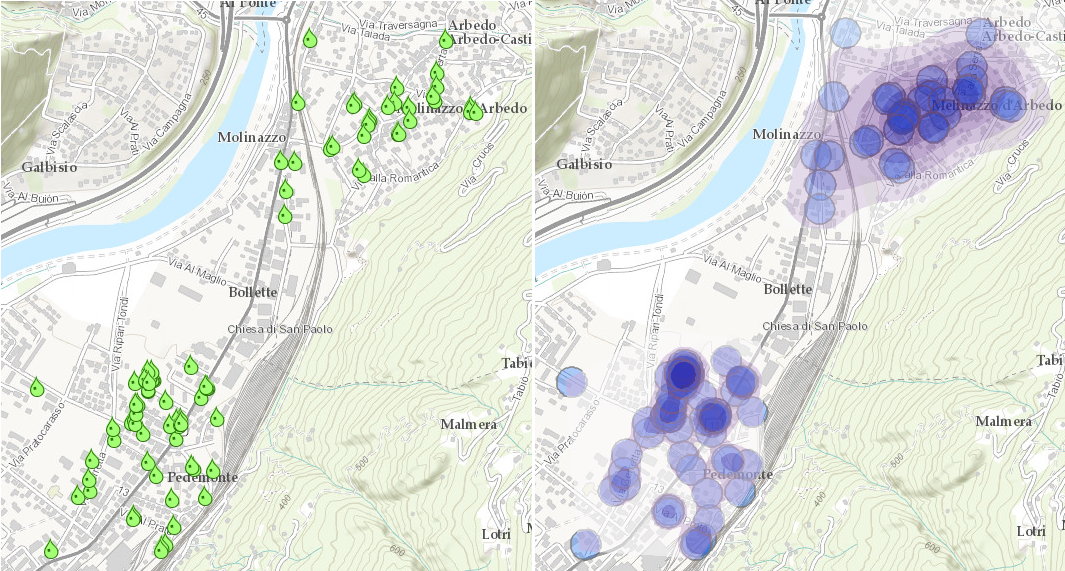
The dispersal distance of adult, i.e. potentially egg-laying, tiger mosquitoes is at most approx. 100 m. Dispersal could therefore be severely restricted if the distance between potential breeding sites is greater than 100 m. Assuming that the municipalities treat the gullies, the distances between the existing water vessels give an indication of whether there would be the possibility of unrestricted spread over several generation times in an area. (Generation time approx. 7-14 d). This was done directly with the recorded data points during the two previous excursions; in the future, graphical analyses will be used for this purpose, which can be carried out directly after the end of collection via ArcGIS Online and added to the maps (see figure above, right).
The students got to talk to the local population during the data collection and thus learned directly how seriously prevention is taken and what measures are already being taken without public prevention measures. The 2015 excursion revealed that there are similar numbers of breeding sites in municipalities with and without prevention and that there are "hotspots" in certain neighbourhoods where, if necessary, an improvement could still be achieved with increased information on the part of the authorities.
In addition to the technical questions (see above), the students in this example also have to deal with legal and organisational questions. Is it allowed to enter a backyard? How large are the areas where no admission could be made? Are the assumptions reasonable?
The determination of the spread of Akebia quinata was only carried out in 2014 and omitted in 2015 due to time constraints. It is planned to record the same site again in 2016 to document spread or retreat. During the one-time survey, however, it was found that the spread has already stopped at narrow wildlife crossings.
Feedback
The feedback on the excursion and the two field experiments was predominantly positive, as the following feedback shows:
- I found the recordings of the possible breeding sites using the app very innovative."
- "... The mapping exercises were also a good idea."
- "It was amazing to see how many plants are not originally from Switzerland. It was also interesting to try out this app for mapping."
- "Very good and interesting explanations on the subject, mapping was great, nice walk."
- "I saw the difficulties of collecting an appropriate amount of data and learned methods (e.g. Esri app) to solve this problem. I also ended up walking more attentively through nature."
In addition, however, there was also very negative feedback: "... Furthermore, I don't find working with smartphones/tablets suitable for an excursion. Firstly, you cannot (yet) assume that everyone owns such a device. Secondly, it is very difficult to ensure that all devices then work as they should. ... Furthermore, working with a smartphone/tablet is tiring and boring. ..."
Lessons Learned
Discuss measures based on the data. After the pure analysis (are there spreading corridors, how much effort does it take to treat gullies), specific measures to improve prevention can also be proposed from the data ("follow-up information") and discussed with the person responsible. For this purpose, it is helpful to present the results in a way that is as meaningful as possible.
Make greater use of ArcGIS Online analysis tools. The immediate informative value of the collected data can be enhanced with suitable analyses for the discussion. The analysis can be triggered via the web interface.
Sensitise students to contact with population. During data collection, students increasingly came into contact with the population, learning details of prevention or being able to make residents aware of it. These aspects could be strengthened by having students actively ask the population if they can visit areas that are not accessible.
GPS limitations. When recording data in the forest, positioning has to be replaced by establishing visible reference points in the terrain due to the very inaccurate GPS location.