Renewable Energies (IntEx)
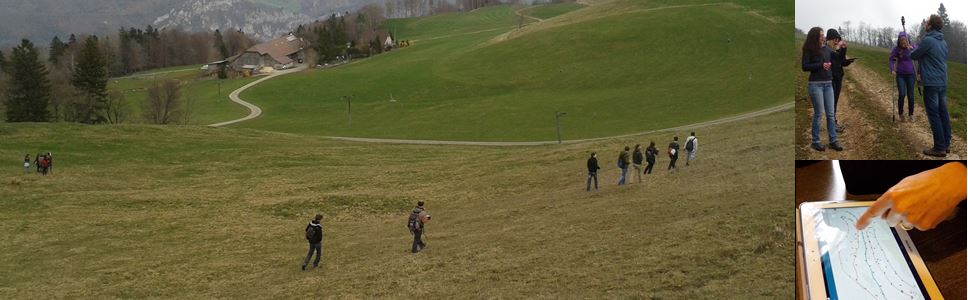
Wind direction and wind speed play a central role in the search for suitable locations for a new wind turbine. With the help of a simple field experiment, the phenomenon of "wind" can be made accessible to the students. The experiment was carried out in Schwengimatt (CH), where a big wind turbine is planned.
Task
The students are to measure wind direction and wind speeds along a slope at two different heights (1 m and approx. 3 m above ground). The focus is on the following questions:
- How variable is the wind near the ground?
- Is the wind speed at a height of 3 m already measurably stronger than at a height of 1 m?
- How is the wind influenced by the terrain?
- How reliable is the data we collect?


The recordings of the two parameters wind direction and wind speeds were made along given transects.
Measurements were to be taken approximately every 25 m. The distance was estimated with the help of step lengths.
The adjacent figure shows the given transects. In addition, the locations of the potential wind turbines were drawn in.
Crowd-Sampling Phase
A total of 26 students took part in this field experiment. The measurements were made in groups of 2 or 3. One group was responsible for recording either the wind direction and speed at a height of 1 m or 3 m. The other group was responsible for recording the wind direction and speed at a height of 3 m.
After a short introduction to the devices and the app, the students had about 30 minutes to record measurement points and transfer them to the app. With the GPS function activated, the students could see their current location with an accuracy of 2-3 m in the input field.
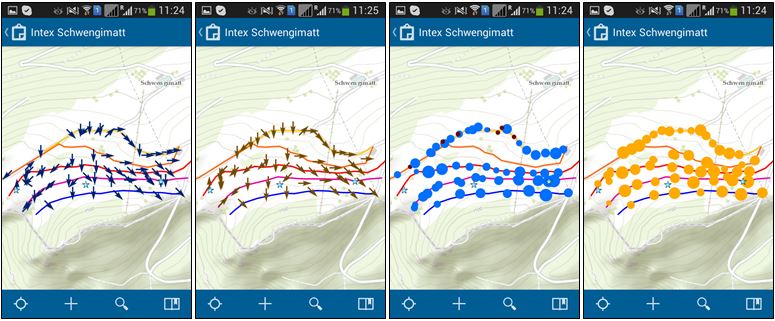
Approximately 100 data points were recorded in the time available. The recording was done in real time, i.e. the students could immediately see their own readings, but also those of the other excursion participants. The results are shown below:
Discussion
With the help of this simple experiment, it was possible to show the participants that the wind follows the terrain. The wind speeds on this day were very low overall. Nevertheless, the measurement results show that the wind strength directly above the ground was much weaker than at a height of 3 m and can vary greatly from measurement point to measurement point. Overall, this experiment demonstrated to the students that the right height has a decisive influence on the productivity and thus on the yield of a wind turbine.
In the 2015 series of measurements, thanks to the comparison with the data of the other groups, a systematic error by one team in determining the wind direction was revealed. This allowed for a constructive discussion about data quality.
Feedback
"Renewable Energies" was the first excursion where a field experiment with mobile data collection was scheduled. The feedback from the students was predominantly positive:
- "The experiment allowed us to see for ourselves how variable the wind can be depending on location and altitude."
- "It was great to save the data via mobile phone. It was fun, and the results were quite nice, so we could see how the wind behaves close to the earth and how the terrain affects it.
- "The results of the experiment that we did ourselves were very memorable. Better than if we had been presented with it theoretically."
A few students complained that the experiment had little to do with the actual topic of the excursion or that the measurements were carried out at an altitude where no wind turbine would ever generate wind.
The feedback from the excursion leader was also positive: "I was very fascinated by how we were able to record a complex phenomenon, namely the variability of wind in complex terrain, with a group of 30 students in a short time, visually represent it and discuss it together straight away". (Prof. Heini Wernli, Institute for Atmosphere and Climate, ETH Zurich, 2014).
Lessons Learned
Align the graphical representation of the results with the research question. Easy-to-read representations (arrows, circles of different sizes) were intuitively readable for the students and allow for an immediate start of the interpretation.
Tight organisation of the start of the measurement by the excursion leader. The technical introduction and group allocation took place on the car journey to the site and the excursion leaders determined the route to be followed with the group on site, which meant that there were no unnecessary delays.
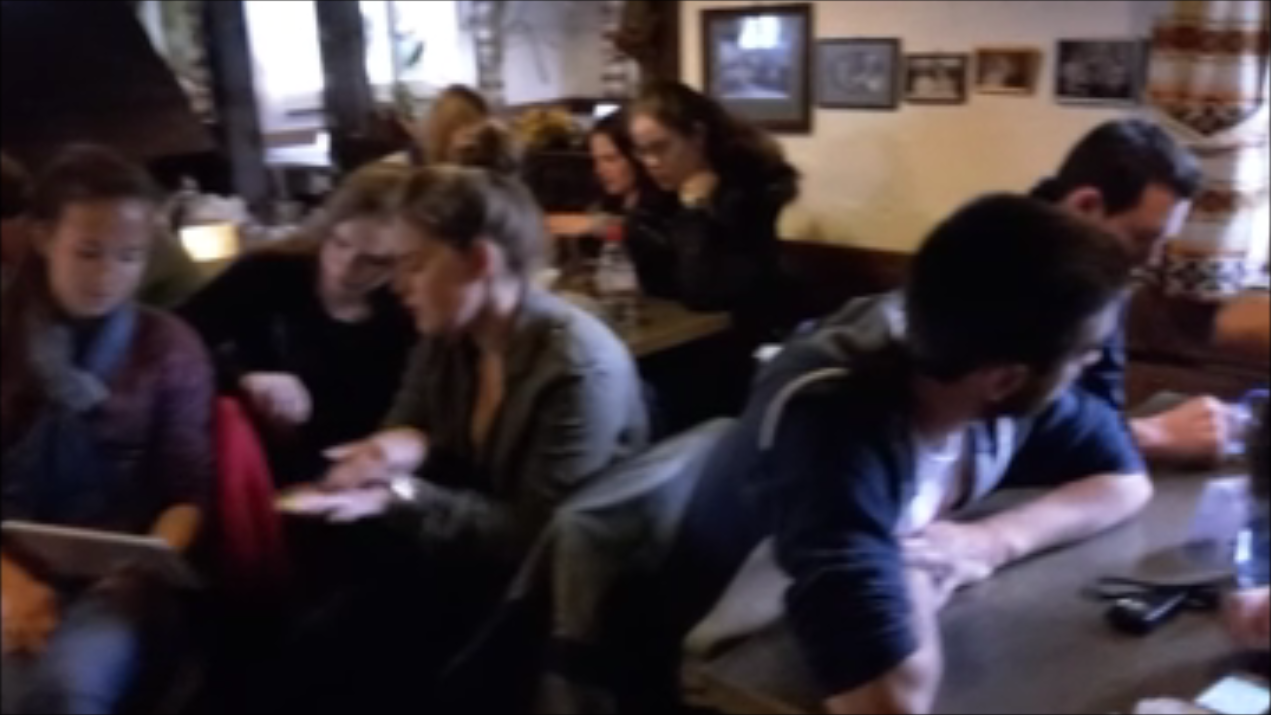
Evaluation in a room with group tables. In the first year, the evaluation of the results took place during the car ride to the next site and led to little interaction due to seating arrangements and acoustics. In 2015, the students sat in groups around tables, had their devices with the results in front of them and discussed among themselves and with the expert.
Timing of measurement and evaluation. The separation of measurement and evaluation by lunch had organisational advantages (toilet breaks) and enabled a smooth transition to the technical discussion, as the students were already sitting together in groups and were in discussion mode.
Small groups as possible. Two people are sufficient for the measurements and the recording with the Collector for ArcGIS app. Larger groups work less focused.